Why Chatbot Arena Understates "New Version Beats Old": Luce's Axiom, Sibling Models, and Bradley–Terry Bias
Every time a lab ships a new version, the same kind of screenshot goes around: the new model sits so many points above the old one on LMArena, and here is the win rate that gap implies. People treat that win rate as a number the leaderboard computes reliably. A paper posted to arXiv in mid-October argues it is exactly the number the leaderboard is worst at. Between near-copies from one family, real votes are more lopsided than the scores imply, and the leaderboard systematically pulls their head-to-head odds toward 50/50.[1]
My reading after going through it: keep trusting the overall order, but discount any “new version beats old” claim, and the discount runs the counterintuitive way. The leaderboard does not overstate the new version. It understates the gap between siblings. The same one-score-per-model assumption also sits under most reward models. The paper offers that link only as a hypothesis, and I will come back to where the evidence stops.
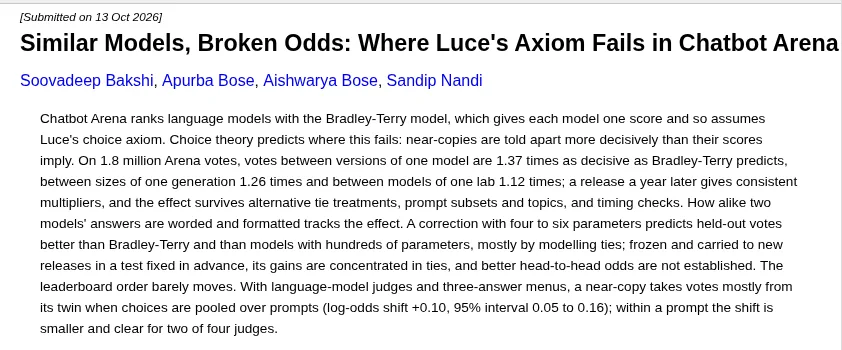
Screenshot: the paper’s abstract page, submitted 2026-10-13 (arXiv, captured 2026-10-19)[1]
One score per model is a strong promise
You know the setup. A user asks a question, two anonymous models answer, and the user votes for the better answer, or calls a tie, or says both are bad.[2] The leaderboard feeds these pairwise battles to the Bradley–Terry model (BT from here on). BT gives each model one score, and the log-odds that model i beats model j is the difference of their scores.[2]
One score per model is a promise in itself. If A usually beats B and B usually beats C, the scores already fix how often A beats C, even if A and C never met. The paper calls this the product rule: log-odds add along any chain. It is the pairwise face of Luce’s choice axiom.[1]
Choice theory has known for over sixty years where that axiom breaks. The classic counterexample is two recordings of one piece of music, later retold as the red bus and the blue bus. People compare two nearly identical options on the few details where they differ, so the better one wins more often than its overall appeal implies. Either one against a different kind of option is a matter of taste.[1] Near-copies are told apart more sharply, and one score per option cannot hold that.
Language models come in families of near-copies: dated versions of one model, sizes of one generation, successive generations from one lab. These are exactly the comparisons a lab cares about when it ships, and exactly where classical theory says one score per model should fail. The paper tests whether it does.
The mechanism: multiply the gap by a decisiveness factor
The change is small. Plain BT says log-odds equal the score gap. The paper multiplies the gap by a factor k that depends only on how the two models are related: two versions of one model, two sizes of one generation, two models of one lab, or unrelated. Unrelated pairs are the reference, with k fixed at 1. A k above 1 means votes between that pair are more lopsided than the gap implies.[1]
One point is easy to misread. k scales log-odds, not probabilities. At k = 1.37, a 55% prediction becomes about 57%, and a 70% prediction becomes about 76%.[1] So this is not “sibling win rates are understated by a third”. The correction grows with the gap and stays small near even odds.
Figure: decisiveness multipliers by relation, with 95% intervals (numbers from Section 5 of the paper; 2024 battle log, ties dropped, pairs with at least 50 non-tied votes)[1]
Why would siblings be more decisive? The paper gives a Thurstone reading. If each model’s utility is its score plus noise, the more correlated two models’ noise is, the smaller the variance of their difference, so the same gap turns into a more certain outcome.[1] Siblings share training data and tuning pipelines, so most of their quirks match, and the comparison rests on the few details that differ. If unrelated pairs have uncorrelated noise, multipliers of 1.37, 1.26, and 1.12 correspond to noise correlations of 0.47, 0.37, and 0.20. Unrelated models share plenty too, so the authors redo it with a reference correlation of 0.3 and get 0.63, 0.56, and 0.44.[1] Treat these as lower bounds, not measurements.
There is also a structural payoff. When a menu holds only two options from one nest, the nested logit reduces exactly to this scaled BT, with k equal to one over the dissimilarity of the pair’s smallest shared nest.[1] That predicts an order: version ≥ size ≥ lab ≥ 1. The estimates land in that order, which says more than “all three numbers are above 1”.
How hard is the evidence? Take it in three layers
The evidence comes in layers of very different strength, so I read them separately.
Layer one: siblings are judged more decisively. This is solid. The main data is the public Arena battle log through August 2024: 1,799,991 anonymous votes on 129 models, April 2023 to August 2024.[1] On the 2,650 pairs with at least 50 non-tied votes (1.14 million votes), the likelihood-ratio statistic against BT is 177.6 on 3 degrees of freedom. Resampling whole model families gives a version interval of 1.20 to 1.76. Dropping any one family leaves the three multipliers at 1.34–1.43, 1.22–1.29, and 1.04–1.15.[1] Votes are overdispersed relative to the binomial (Pearson chi-squared per degree of freedom 1.71), and dividing by that still leaves a likelihood ratio of 104.[1]
What convinced me more is the model-free check. For every pair with at least three shared opponents, the authors compare the direct head-to-head log-odds with the log-odds implied through those opponents, using disjoint votes. Under BT the slope of direct on indirect is 1. It is 0.99 for unrelated pairs, 1.10 for same-lab pairs, 1.23 for size pairs, and 1.28 for version pairs.[1] The check does not depend on the authors’ parameterization, and it points the same way. One concrete case: plain scores give yi-large-preview a 55% chance against yi-large, but in 229 decisive head-to-head votes it wins 65%.[1]
The robustness checks are thorough. A few worth remembering: with a separate score per model per week, the multipliers are 1.36, 1.23, and 1.13. Dropping each model’s first four weeks makes the version effect larger, at 1.64. Unrelated pairs launched within 14 days of each other, used as a placebo, get 0.99.[1] Together these rule out the obvious artifact, where a new model is sampled heavily against its predecessor right after launch.
Layer two: how you count ties changes the size. Siblings are more decisive and they also tie more. 44% of votes between version pairs are ties, 43% for size pairs, and 35% for unrelated pairs.[1] The paper puts it as: near-copies are either called a tie or called decisively. That matters in practice. Arena’s own convention counts a tie as half a win. Under that rule the multipliers drop to 1.19, 1.10, and 1.06. A Davidson model that keeps every tie gives 1.21, 1.23, and 1.13.[1] The size and lab effects hold up under every tie rule. The version effect moves with the rule. If someone tells you to multiply sibling odds by 1.37, ask how they handled ties.
Layer three: whether the correction transfers to new data is unsettled. The authors ran a transfer test fixed in advance. They learned the correction on the 2024 log, froze it, and used it to predict sibling votes in the 2025 release. The primary outcome, the gain in win-odds log loss, is +0.14 millinats (interval −2.92 to +1.68). The three-outcome gain is +9.7 (interval −0.5 to +19.3). Both intervals include zero, so the test is inconclusive.[1] The frozen multipliers also tend to overcorrect, pushing calibration slopes down to 0.88–0.95.[1] An appendix diagnoses why. Score noise is largely ruled out, and joint estimation and drift between releases each contribute a little, with neither reaching significance.
My view of this layer: the authors were honest in labeling it unestablished, and readers should use it that way. “Siblings are underpriced” is an observed fact. “Correct future leaderboards with a fixed set of multipliers” is not something you can do yet.
The order barely moves; the bias lands on the number you care about
This is the most useful result in the paper, and the one a clickbait summary would skip.
Figure: what the correction does to the whole leaderboard versus to sibling odds (numbers from Sections 5, 6.1, and 8)[1]
On the 2024 log, re-scoring with the lineage correction gives a rank correlation of 0.9999 with plain scores. The mean model moves 2.2 Elo points and the largest move is 8. Arena-style ranks move by at most 3 places, and no sibling pair swaps order. The reason is simple: about 89% of votes are between unrelated models, and sibling battles are a small slice of the total.[1] On the 2025 data the similarity correction moves some models by up to 21 Elo points, mostly models whose answers are unlike everyone else’s.[1]
Sibling odds are another story. On held-out 2024 votes, BT’s sibling odds are too close to even by about 9% on the log-odds scale, and by 3% to 11% when scores come from unrelated votes alone.[1] In the authors’ words, those are the numbers a lab reads when it asks whether a new version beats the old one.
So when I read a leaderboard, I split the two questions. “Who is on top right now” comes from the overall board as before. “How much better is the new version” should not come from converting the score gap into a win rate, because that conversion shrinks the real gap. When the new version is stronger, it actually wins more than the gap says. When it is weaker, it actually loses more.
Answers that look alike are the more direct explanation
Section 5.2 does something I found clever. Instead of family labels, it measures how similar two models’ answers are and asks whether that predicts decisiveness. The measures are wording (TF-IDF cosine), meaning (sentence-embedding cosine), style (distance between counts of headings, lists, bold spans, code blocks, table rows, paragraphs, emoji, and length), and the length gap.[1]
Siblings do write alike. On wording similarity, version pairs sit 2.4 to 3.0 standard deviations above the average pair, size pairs 1.5 to 1.7, and same-lab pairs 0.8 to 0.9. Pairs with more similar wording also tie more (correlation 0.36 to 0.43).[1] In the 2025 release of 140k votes, wording alone predicts decisiveness at ×1.12 per standard deviation, with a likelihood ratio of 66.9. Adding the family labels contributes only 0.8 more, so the labels have little left to explain. Meaning similarity predicts much less, and reading the whole answer does no better than reading its opening.[1]
The 2024 release of 100k votes disagrees on one point. There, style is the best single measure, list structure carries most of it, and the family labels still add information on top of every text measure.[1] The two releases disagree on whether surface similarity explains the whole family effect. They agree on the ranking: surface similarity predicts decisiveness better than similarity of meaning. The authors are explicit that these are associations, and that similarity is better read as a partly measured mediator than as a cause.
This section made me rethink LMArena’s own style control. In August 2024, LMSYS added four style features to the BT regression: answer length, header count, bold count, and list count. Length was the dominant factor. With the controls, GPT-4o-mini and Grok-2-mini fell below most frontier models, while Claude 3.5 Sonnet, Opus, and Llama-3.1-405B rose substantially.[3]
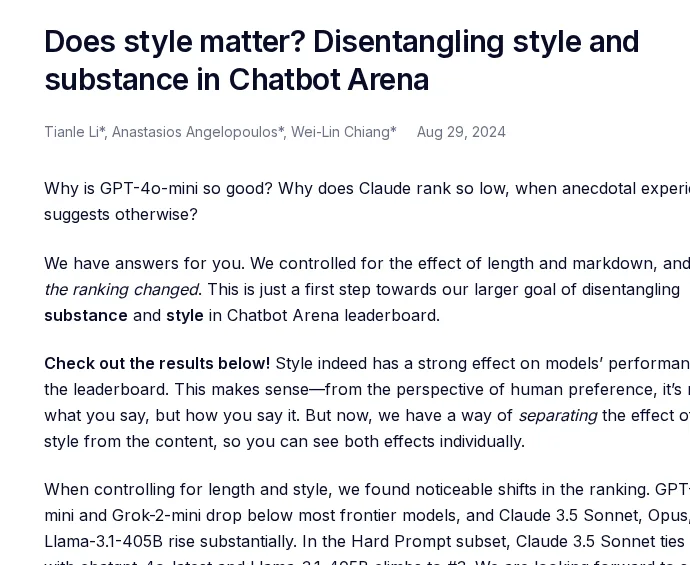
Screenshot: opening of the LMSYS style-control post (published 2024-08-29, captured 2026-10-19)[3]
Both deal with formatting, but they act in different places. Style control adds a shift to each battle: the longer answer gets a bonus that is taken out of the model’s score. The new paper changes the scale: the more alike two answers are, the more certain the outcome for the same gap.[1] The paper draws this distinction itself. Style control fixes “voters like long answers”. It does not fix “sibling odds are pulled toward even”, and the reverse also holds. If your internal evaluation controls only for length, the sibling problem is still there.
Read it next to the Leaderboard Illusion
Last year, The Leaderboard Illusion, from Cohere Labs and coauthors, criticized Arena from a different angle. A few providers could test many variants privately and publish only the best score. Proprietary models were sampled more and removed less. The authors counted 27 private variants tested by Meta in the month before the Llama 4 release.[4] Two identical Aya-Vision-8B checkpoints, submitted separately, ended at 1052 and 1069, with four models between them.[4]
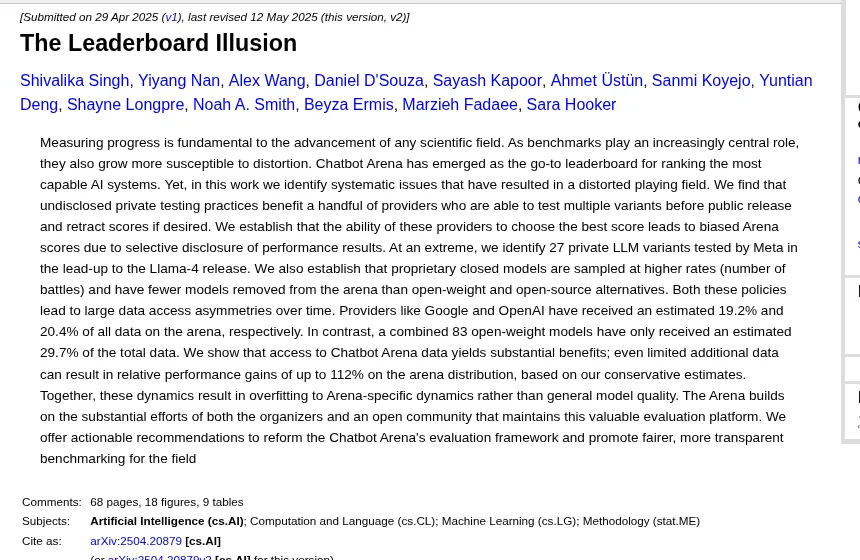
Screenshot: abstract page of The Leaderboard Illusion (arXiv, v2 2025-05-12, captured 2026-10-19)[4]
The two papers describe different problems. The Leaderboard Illusion is about sampling and disclosure: who plays, how often, and whose scores can be retracted. Those break BT’s assumption of unbiased sampling.[4] The new paper is about the form of the model: even with perfectly fair sampling, one score per model cannot hold the structure between siblings.[1] The new paper checks whether launch-period sampling could create the effect it sees and finds no sign of it.[1]
Reading them together suggests something practical. Privately testing several variants and keeping the best means comparing the closest siblings there are. By the new paper’s result, battles between them are especially decisive, so even near-identical checkpoints can pull apart. By the Leaderboard Illusion’s result, taking the maximum pushes the score up on its own. Stack the two and the best private variant is both easy to single out and easy to overrate. Neither paper tests this directly. It is my reading.
A three-answer test: the red bus shows up halfway in model judges
Arena only ever shows two answers, so its data cannot test the core of Luce’s axiom: the odds between two options should not depend on what else is on the menu. The authors used language models as judges so they could control the menu.[1]
Figure: design and results of the three-answer menu test (numbers from Section 7 and Appendix H)[1]
Eight inexpensive models answered 200 randomly drawn English Arena prompts. That gives two version pairs (Llama 3.1/3.3 70B, Mistral Small 3.1/3.2) and two size pairs (Llama 3.1 8B/70B, Qwen3 14B/32B). Four judges from four labs (Claude Haiku 5.5, GPT-4.1 nano, Gemini 2.5 Flash-Lite, DeepSeek V3.2) saw the prompt and two or three anonymous answers and replied with one letter, for 138,400 judgements in all.[1] The key comparison: put S₁, its sibling S₂, and an outsider T on the menu, then swap S₂ for a model U from a third lab, and see how much the outsider’s odds over S₁ change. Luce says they should not.
Pooled over prompts, the mean shift across the four judges is +0.10 (interval 0.05 to 0.16), and 51 of 64 designs are above zero. Add a near-copy and it takes its votes mostly from its twin.[1] Within a single prompt, though, the shift is only +0.03 (interval −0.03 to 0.09). Only GPT-4.1 nano and DeepSeek V3.2 show a clear effect, at +0.12 each.[1] The authors’ explanation is that siblings are strong and weak on the same prompts (win-share correlation across prompts of 0.35, 0.27, and 0.25, against 0.09 for unrelated pairs), so prompt heterogeneity contributes part of the pooled effect. In human data from PRISM, only Claude 2.0/2.1 shows a clear red-bus shift.[1]
I take one conclusion from this section. In multi-answer evaluation, a pick rate is not a Luce-style strength, because at the pooled level a sibling dilutes its twin. Whether a single judge on a single prompt truly violates Luce has only half the evidence it needs.
Read the reward-model section as a hypothesis
The discussion section turns to RLHF. Most reward models use the same BT likelihood, and preference pairs often contain two samples from one policy, the closest siblings possible. If the sibling effect holds there, DPO, which fits one β to every pair, would learn reward gaps on such pairs k times too large, and a β scaled by similarity would put them back on one scale.[1]
It is an interesting idea, and the authors are clear about its status in both the introduction and the discussion. Arena scores a model across prompts, while a reward model scores an answer given its prompt. Arena evidence cannot show that a single temperature is misspecified there, so they state it as a hypothesis.[1] I would use it the same way. It is worth checking on your own preference data. It is not a reason to change a training recipe.
Reproduce the model-free check on your own data
If you run an internal pairwise evaluation (many teams use one to pick prompt versions or fine-tuning checkpoints), the part of this paper most worth copying is not the correction model. It is the model-free check, because it does not ask you to trust any parameterization. Here is the procedure:
- Tag every pair’s relation before you look at any votes. For example, different step counts of one checkpoint are “version”, different sizes of one recipe are “size”, and everything else is “unrelated”.
- For each pair with at least three shared opponents, compute the direct head-to-head log-odds. Then compute the log-odds implied through the shared opponents, as an inverse-variance weighted average. Keep the two sets of votes disjoint.[1]
- Group by relation and regress direct on indirect through the origin. The unrelated slope should be close to 1. If your sibling groups sit clearly above 1, your leaderboard is also understating sibling gaps.
The paper flags one trap. Siblings tend to have smaller gaps, and at small gaps even unrelated pairs show a slope slightly above 1 (1.08 in the closest fifth). Before comparing, reweight the unrelated pairs to the siblings’ gap distribution. After the authors did this, the unrelated slopes came back to 0.98–1.00.[1] Skip that step and you will mistake “small gap” for “close relative”.
What to take away when you read or build a leaderboard
Compressed into actions:
- Keep reading the overall order. The correction barely changes it, and nothing in this paper changes who is at the top.[1]
- For “how much better is the new version”, do not convert the score gap into a win rate. The leaderboard shrinks sibling gaps. If you have direct head-to-head votes between the two versions, prefer those, and ask how ties were counted.
- Model ties separately in your own pairwise evaluation. Most of the correction’s gain comes from the tie terms, and siblings tie much more. Counting a tie as half a win erases both the decisiveness signal and the tie-rate signal.[1]
- Record answer similarity. Wording similarity is the cheapest covariate and the strongest predictor, and on the 140k release it absorbs nearly all of the family effect.[1] The 140k dataset already ships length and markdown counts as metadata for style control, so you can start experimenting with it directly.[5]
- Style control and scale correction are different fixes. Length control changes the shift. The sibling problem changes the scale. You need to think about both.[3][1]
- Do not carry fixed multipliers to a new leaderboard. The frozen transfer test did not hold up, and calibration overshot. Re-estimate on each new data set.[1]
Earlier posts on this site cover neighbouring problems. Why more tasks won’t fix an agent leaderboard is about task-level noise. The Mercor labor index is about how far benchmark coverage sits from real work. CheatBench is about the model under test gaming the score. This paper fills in another piece. Even when the questions, the coverage, and the model under test are all fine, the statistical model that aggregates the votes can fail in a specific place, and that place happens to be the number release announcements like to quote most.
References
- Soovadeep Bakshi, Apurba Bose, Aishwarya Bose, Sandip Nandi, “Similar Models, Broken Odds: Where Luce’s Axiom Fails in Chatbot Arena,” arXiv:2610.19095: https://arxiv.org/abs/2610.19095 ↩
- Wei-Lin Chiang et al., “Chatbot Arena: An Open Platform for Evaluating LLMs by Human Preference,” arXiv:2403.04132: https://arxiv.org/abs/2403.04132 ↩
- Tianle Li, Anastasios Angelopoulos, Wei-Lin Chiang, “Does style matter? Disentangling style and substance in Chatbot Arena,” LMSYS blog: https://lmsys.org/blog/2024-08-28-style-control/ ↩
- Shivalika Singh et al., “The Leaderboard Illusion,” arXiv:2504.20879: https://arxiv.org/abs/2504.20879 ↩
- LMArena, arena-human-preference-140k dataset (Hugging Face): https://huggingface.co/datasets/lmarena-ai/arena-human-preference-140k ↩