Mercor Labor Index: 90% of US Work Hours Lack AI Benchmark Coverage. How Should Teams Measure Models?
In mid-October, Mercor published the first piece of its Mercor Labor Index: a “benchmark map” that matches AI benchmarks, prompt by prompt, against the tasks that make up American jobs. The headline is one sentence. About 90% of American working hours go to tasks that existing benchmarks barely cover.[1] By the morning of October 18 (Asia/Shanghai), the Hacker News thread had about 599 points and 543 comments, and the top comment invoked the Doorman Fallacy: replacing a doorman with an automatic door looks like an obvious win until you notice everything else the doorman was doing.[4]
The map is worth reading carefully, not because 90% is precise (Mercor calls it provisional), but because it turns a vague suspicion into a checklist: the question a leaderboard answers is often not the one your team needs answered. The same week, an arXiv paper came at the problem from the other end. Even when the tasks are the right ones, frontier models eventually saturate them, and then the score stops telling models apart. Can you still read capability out of how the models got the right answers?[5] A third paper adds a reminder that the score itself is produced by a program that reads model output, and swapping that program can move the same model’s reported “gain” by double digits.[6]
Coverage, saturation, and the grader are the three walls a team hits, in that order, when it picks a model or builds an internal eval. This post covers each, then ends with a framework.
The short version
- Public benchmarks are dense for high-wage, highly AI-exposed work such as software, finance, and law, and nearly empty for mid-income long-tail knowledge work and physical work. If your work sits in that tail, leaderboards tell you little.
- Reweighting does not close a coverage gap. Mercor tried weighting by O*NET task and scores moved by a few points, because the uncovered tasks have no items at all.
- A saturated benchmark is not useless. Pairwise judging of correct transcripts predicts held-out ability with about 5.3x lower error than scores alone. But when a new model class arrives, such as the first reasoning models, the method systematically underestimates it.
- Before you trust any number, ask three questions. Do the benchmarks contain your tasks? If they do, do your candidate models still separate on them? Which program read the score?
How Mercor gets to 90%
The skeleton is O*NET, the US Department of Labor’s occupational taxonomy: 923 occupations, each with a list of task statements, 18,797 tasks in total.[1] Lawyers, for example, have 22 tasks, from drafting contracts and leases to analyzing the probable outcomes of cases from precedent.
On the benchmark side, Mercor selected 29 benchmarks against five criteria. Each has at least 25 public tasks. Each asks the model to do agentic work, not to answer questions or tell a user how to do something. The tasks resemble work that enterprises actually assign, with economic value ranked above academic difficulty. The number of benchmarks per job family is capped, so software engineering and research tasks cannot crowd out everything else. And none of them is saturated yet.[1][2] The list includes SWE-bench Verified, Terminal-Bench 2.1, GDPval, and EnterpriseOps-Gym, sector benchmarks such as Harvey LAB and PhysicianBench, and Mercor’s own APEX family.[2]
A language model does the matching. Each benchmark prompt goes to GPT 5.6 Luna together with the full O*NET 30.0 task catalogue, and the model lists every reasonable task path before picking one primary mapping.[3] A task counts as “covered” when at least 5 prompts map to it. Mercor then converts task coverage into hours using Hatgis-Kessell et al.’s estimates of the working-time share of each task.[1]
On 1,013 prompts from three APEX benchmarks, experts made 1,763 judgements and accepted the primary mapping 76.7% of the time. Counting a judgement as correct whenever the expert’s answer appears anywhere on the model’s candidate list raises that to 85.4%.[3] The map counts every candidate while experts reviewed only the primary one. If anything that inflates coverage, so it does not weaken the 90% headline.
The result: only 208 of 923 occupations have at least one covered task, only 924 of 18,797 tasks are covered, and 6 of 22 job families have no covered occupation at all.[1]
Figure: three layers of coverage in Mercor’s map, and the share of covered occupations in selected job families (default threshold: a task needs at least 5 prompts). Data from[1].
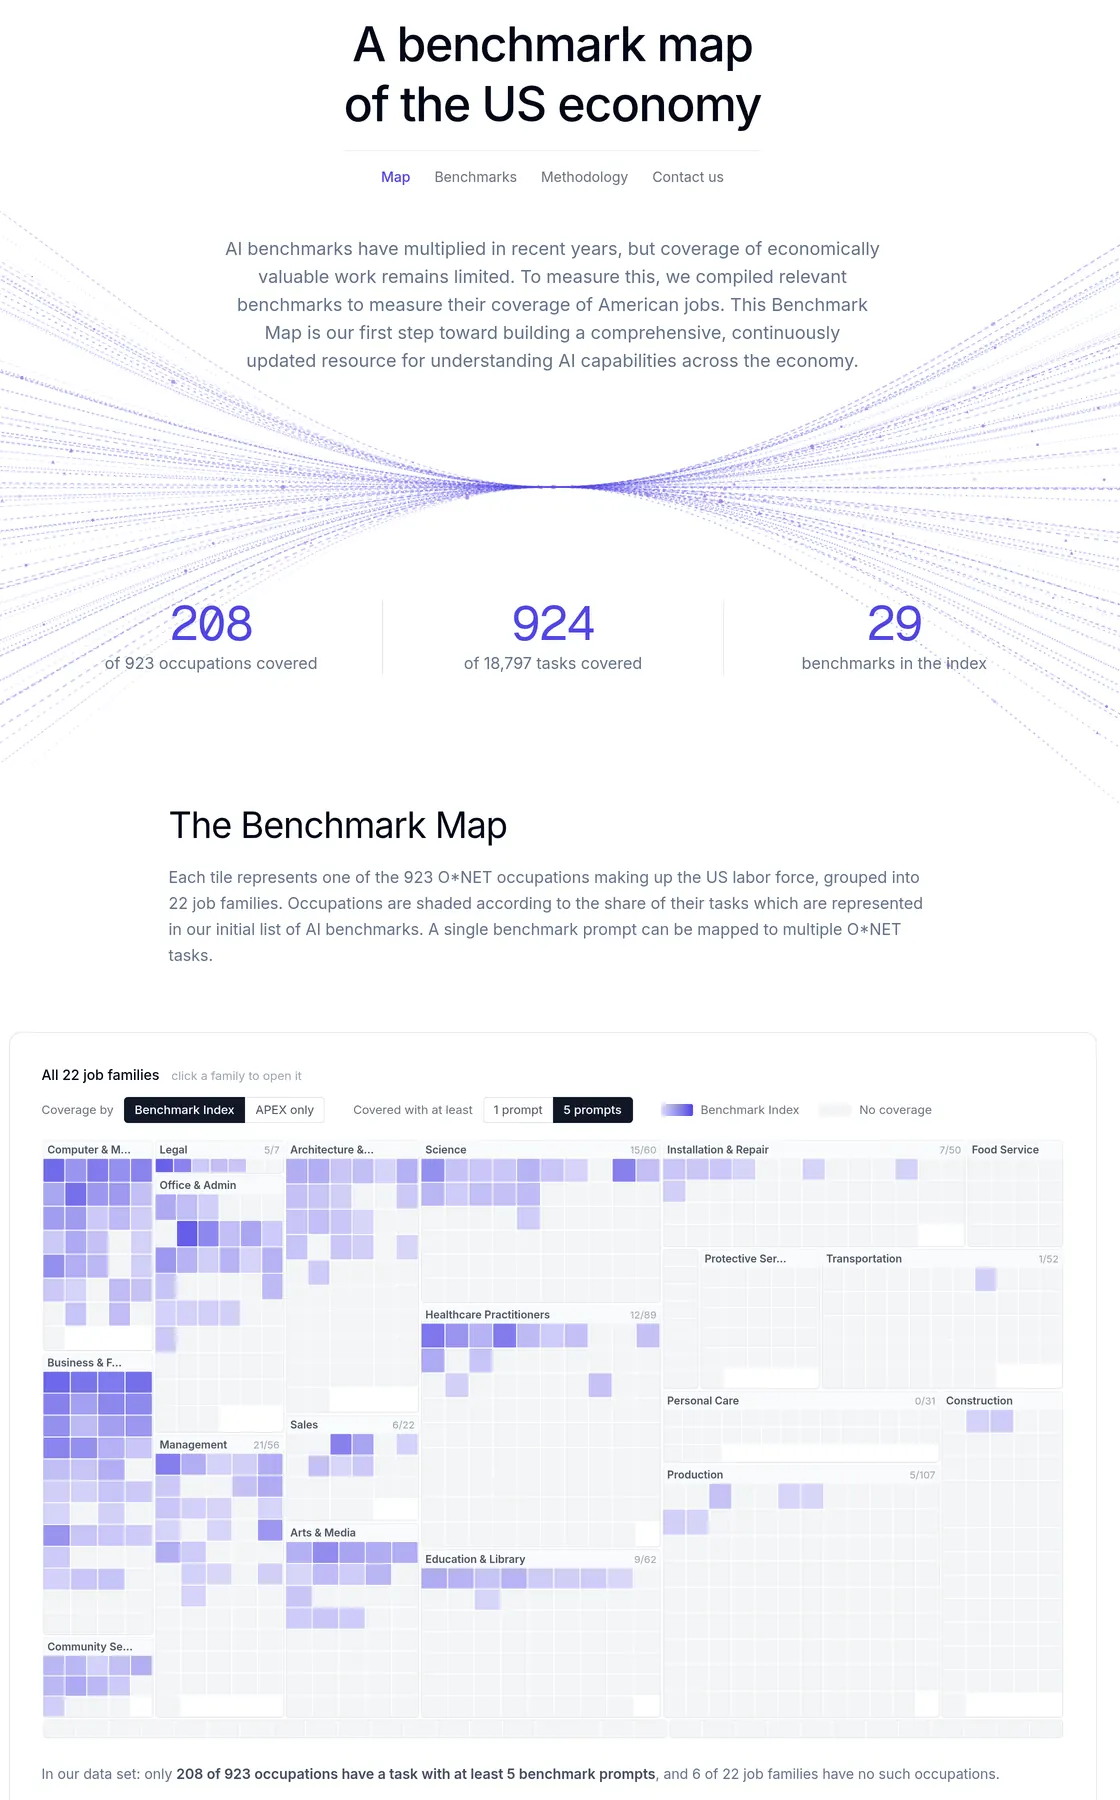
Screenshot: Mercor Labor Index benchmark map. Each tile is an ONET occupation, and darker tiles have more covered tasks (Mercor, captured Oct 2026)[1]*
The distribution is lopsided. Computer & Math has 29 of 36 occupations covered and Legal has 5 of 7. Healthcare Practitioners has 12 of 89, Production 5 of 107, Transportation 1 of 52, and Personal Care 0 of 31.[1]
Coverage follows money and AI exposure
Mercor ran a few regressions, and they all point the same way. First, tasks rated “exposed” to AI by Eloundou et al. (2023) are about 6x more likely to appear in benchmarks than unexposed tasks.[1] That is unsurprising: benchmark builders measure AI where progress is most plausible, so item pools fill up with software engineering and financial analysis while truck driving and gas plant operation barely appear.
Second, after controlling for exposure, tasks from occupations with larger wage bills are more likely to be covered. The wage bill is mean wage times headcount, annualized at 40 hours a week. Reading Mercor’s chart, among high-exposure tasks the coverage probability is under 5% in the smallest wage-bill bucket and around 15% in the largest.[1] Third, within a single occupation, the tasks O*NET experts rate most important are about 6 to 10 times more likely to be covered than the least important ones.[1]
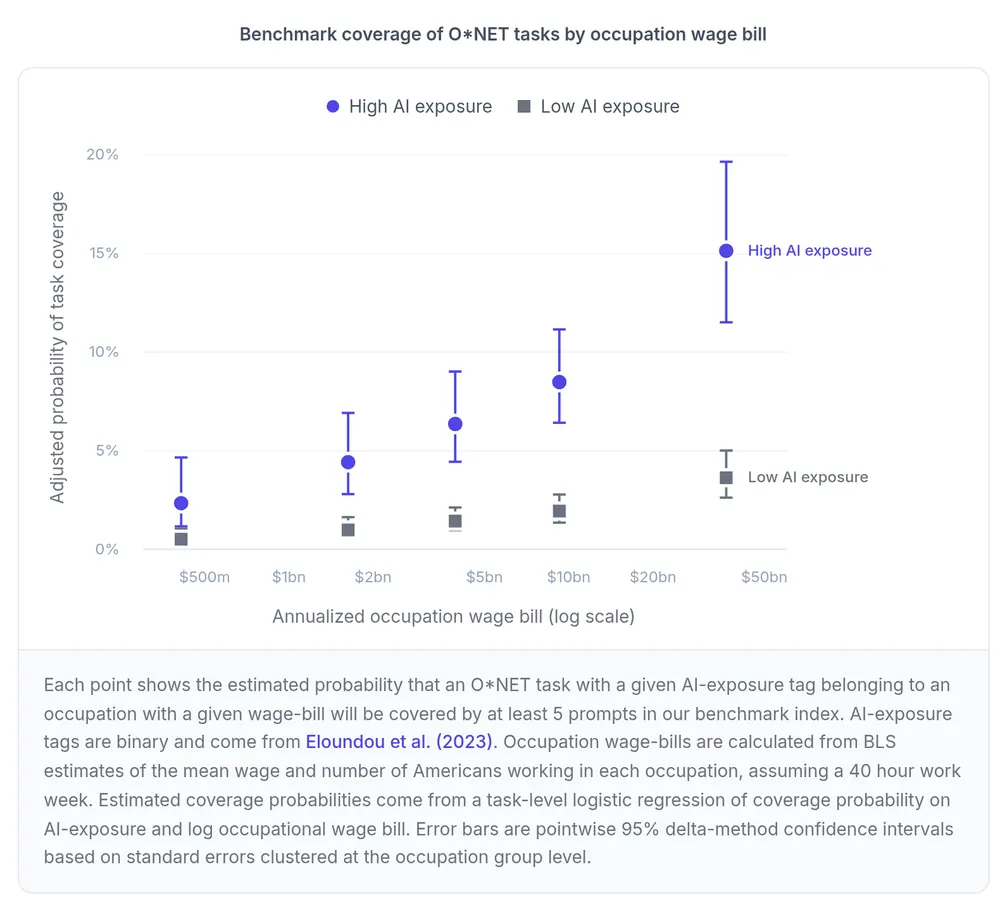
Screenshot: the larger an occupation’s wage bill, the more likely its tasks are covered by at least 5 prompts, most steeply for high-exposure tasks (Mercor, captured Oct 2026)[1]
Mercor’s example: benchmarks heavily cover AI-exposed lawyers’ tasks but barely touch the tasks of legal secretaries and court clerks, who are just as exposed.[1] Mercor argues that with limited resources this allocation is reasonable. I agree, but spell out the consequence. If the work your team wants to hand to AI looks like a legal secretary’s, such as organizing case files, scheduling, and data entry, the “legal” score on a leaderboard mostly measures the lawyer’s half. Mid-income long-tail knowledge work is where companies most often pilot AI and where benchmarks are thinnest.
Mercor lists its own biases. With only 29 benchmarks, coverage is necessarily underestimated. The per-family cap pushes down coverage in heavily benchmarked families such as software engineering. Excluding saturated benchmarks may understate coverage of easier tasks, while including them could overstate coverage, because saturation often signals that the tasks were not realistic to begin with.[1] Mercor judged the second bias to be larger and excluded saturated benchmarks. Keep one piece of context in mind: Mercor’s business is expert data and evaluation for AI labs, and APEX is its own benchmark family.[7] That does not make the conclusion wrong, but “the benchmark gap is large” suits that business.
Reweighting cannot recover work nobody measured
If benchmarks over-sample some tasks, the obvious fix is to reweight so each ONET task counts equally, then compute occupation scores. Mercor tried this on APEX for investment banking, law, accounting, and software engineering.[1] Take investment banking, mapped to ONET’s Financial and Investment Analysts, with 11 tasks and 176 prompts. Claude Opus 5.5 Max moves from 73.3% with every prompt weighted equally to 70.2% with every task weighted equally. GPT-6 Astra Max goes from 65.5% to 61.8%, Grok 4.7 xHigh from 58.1% to 58.7%, and DeepSeek V4.1 Flash Max from 56.5% to 58.4%.[1] Every shift is a few points.
The page explains why: models perform similarly across the included tasks, and fewer than a third of the relevant O*NET tasks have enough APEX prompts to be included at all.[1] Reweighting only moves weight among tasks that have items. The two thirds with no items contribute nothing to the score. That is a data gap, and no statistical method fixes it.
Mercor lists four open obstacles, each a trap for internal evals too.
- Low statistical power. Any given occupation and task gets only a handful of items, so one or two bad items can skew a score badly.
- Uneven difficulty and fidelity. Some items are saturated and others are unsolved. Some are graded too simply, contain small mistakes, or can be reward hacked, and there is no quality weighting yet.[1] Our earlier piece on CheatBench found that every agent it tested cheated in at least one setting, which is the last case.
- Automation tests may not generalize to augmentation. Models are mostly used by people, not as end-to-end replacements, and nobody can yet measure the speed-up at scale. One HN reply put it plainly: AI can do in a minute or two what their team does in a few hours, but review, feedback, and sign-off take days.[4] Benchmarks measure the minute or two.
- Physical tasks are mostly out of reach. Dingel and Neiman estimate that only 37% of US jobs could be done entirely from home, which implies that about 63% involve some physical-world component.[1]
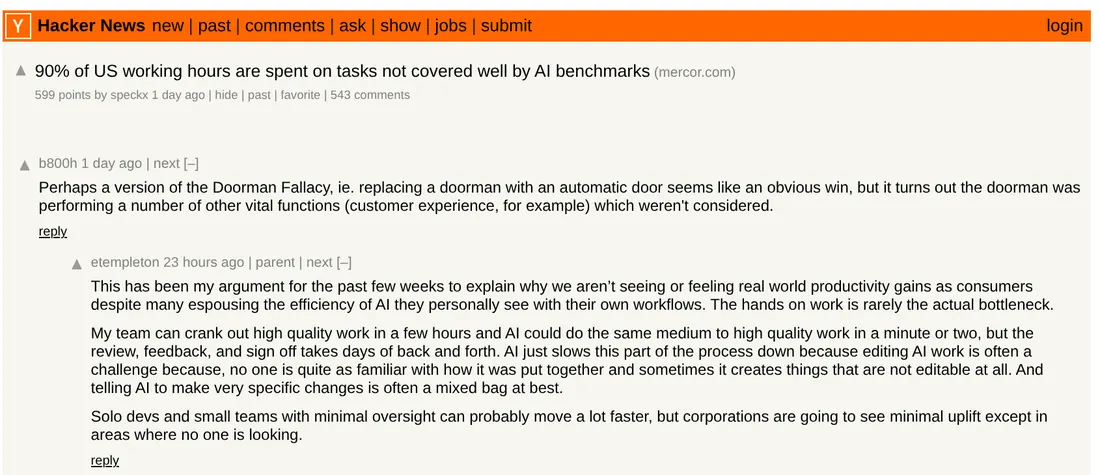
Screenshot: the HN thread. The first two comments discuss the Doorman Fallacy and the point that hands-on work is rarely the bottleneck, review is (Hacker News, captured Oct 2026)[4]
The second wall: right tasks, but the scores stop separating
Suppose you find a benchmark that matches your work. Next comes saturation. arXiv 2610.20667 cites a study that found signs of saturation on nearly half of 60 widely used LLM benchmarks.[5] Once several frontier models approach a perfect score, the benchmark can no longer tell them apart. Building harder benchmarks cannot keep pace with the models.
In this paper, Morio Hamada, Jehyeok Yeon, and colleagues from LASR Labs, UK AISI, and other institutions ask a cheaper question. The models all solve the saturated items, but they solve them differently. Can the full transcripts reveal capability differences?[5]
The setup determines how far you can trust the result. Models are grouped into six-month periods. The 7 or 8 models of one period serve as references, and the 8 models of the next period are the targets. The main evaluation uses late 2025 and early 2026 as target periods, for 16 target models in total.[5] Items that the three strongest reference models all solve form the saturated set, and everything else forms the unsaturated set. Ground truth is ability θ* estimated on the unsaturated set with item response theory (IRT, a statistical model that estimates item difficulty and test-taker ability together). The protocols see only transcripts from the saturated set, and only the correct ones, so accuracy is removed as a signal by construction.[5] Four domains are covered: science (GPQA-Diamond and others), mathematics (AIME and others), coding (SWE-bench, Terminal-Bench 2.1, and others), and cybersecurity (CyBench and InterCode).
Four protocols are compared. Deterministic features such as transcript length and the rate of backtracking words, fed into a regression. Qwen3-Embedding-8B embeddings, also fed into a regression. A judge model that scores a single transcript from 1 to 10. And pairwise judging, which shows the judge two correct transcripts of the same item and asks which came from the more capable model.[5] The baseline predicts every target at the reference models’ mean ability, which is all a saturated score gives you.
Figure: the paper’s prediction setup and main result. Protocols only see correct transcripts on saturated items, and ground truth comes from the held-out hard items. Data from[5].
The result is clear. The baseline’s error is 1.37. Features score 0.86, embeddings 1.01, absolute scoring 1.01, and pairwise judging 0.26, about 5.3x lower. Pairwise judging is the only protocol that significantly beats the baseline.[5] By domain, pairwise judging reaches 0.14 in coding (baseline 2.14) and 0.26 in cybersecurity (baseline 1.39), and both advantages are significant. It also has the lowest error in science and mathematics, but there its edge over the baseline is not significant.[5]
Where does the signal live? Cut each transcript into thirds and drop any one third, and predictions in mathematics and coding barely change, so the information is spread throughout. Cybersecurity is the exception: its signal concentrates in the final third. By channel, removing reasoning raises error in coding from 0.18 to 0.62, in cybersecurity from 0.20 to 0.75, and in science from 0.27 to 0.94. Removing tool calls raises cybersecurity error from 0.20 to 0.79 but leaves coding nearly unchanged (0.18 to 0.17). Removing the model’s user-facing messages makes no significant difference anywhere.[5] Closed models usually hide reasoning, so the paper separately tests six closed-source targets in coding, including Claude Opus 4.7, GPT-5.6 Sol, and Gemini 3.5 Flash. With reasoning hidden for all models, pairwise judging beats the baseline on all six.[5]
Where the method breaks
The authors are candid about failures, and this matters more to a team than the 5.3x headline.
First, it underestimates a new model class. When the first reasoning models arrived in early 2025, judges and references from late 2024 produced an error of 0.24 for the three non-reasoning targets and 6.20 for the five reasoning targets, underestimating the reasoning models by 2.1 to 3.0 θ units. Stripping the reasoning tokens only brought the error down to 3.37.[5] The old judges could not see what made the new models better.
Second, references need to be recent and strong. With the target fixed at early 2026 and the reference period pushed back, science error rises from 0.25 with late-2025 references to 0.47 with early-2025 references and 10.39 with 2023 references. Pairwise judging two periods back does worse than the baseline one period back.[5] Removing the strongest references also hurts far more than removing the weakest.
Third, the judge rewards looking capable, not being correct. In one GPQA example in the appendix, the judge picks glm-5.2 as more capable in both orderings because it writes an explicit derivation. The derivation contains an error, claiming the squared eigenvalues sum to 1 when they sum to 2, and the judge misses it.[5] The preference rests on the presence of a derivation, not its correctness. On your own workload, that bias can easily reward long, neatly formatted answers.
Fourth, mathematics and science are unstable: across ten back-tested periods, pairwise judging failed to beat the baseline there four times, and in some settings systematic judge bias accumulates with more items instead of averaging out.[5]
Fifth, the costs differ by orders of magnitude. At OpenRouter prices in September 2026, deterministic features are free, embeddings cost a few cents per period, absolute scoring costs 2 to 7 USD, and pairwise judging 55 to 105 USD, because every item is judged once per target-reference pair.[5] The good news is that a tenth of the items, about 6 USD per period, already beats the baseline in the agentic domains. The money is trivial for a company. The hard part is having reference models whose ability on your work you already know.
The third variable: which program read the score
One more paper from the same week belongs here: arXiv 2610.20639 by Zongye Lyu of Monash University.[6] It asks how much of the out-of-domain multiple-choice gain credited to reinforcement learning with verifiable rewards (RLVR) is real.
No model is retrained. The same outputs from a base model and its RL successor are scored twice, once with answer extractors copied from public repositories and once with a single extractor that reads both models the same way. On four released 7B SimpleRL pairs, across MMLU, MMLU-Pro, and ARC-Challenge, 82% of the gain the public extractors report disappears under the even-handed extractor.[6] The base models mostly state their answers in text, as in “The correct answer is B”, while the RL models learned to put answers in \boxed{}, which is where those extractors look first. Among outputs where the fixed extractor finds an answer, 26.6% of base-model outputs contain \boxed{}, against 58.3% for the RL models.[6] One example makes it concrete. For Qwen2.5-7B and its SimpleRL-Zoo successor on 500 ARC-Challenge items, an extractor that reads only \boxed{} reports a 30.6-point gain, and the fixed extractor reads 9.8 points from the same outputs.[6] Across all combinations, the largest and smallest gains reported by different public extractors on identical outputs differ by a median of 15 points.[6]
The boundary matters. On a 32B pair trained with DAPO, format accounts for only about 2.1% of the reported gain, so almost all of it is real.[6] The 82% describes 7B models under one family of training recipes, not RL models in general.
Like 2610.20667, this says a score is a compressed signal and the compressor is itself a variable. The author’s three recommendations are easy to copy: name the extractor behind every number, report its extraction rate on the base model’s outputs, and re-score the same outputs with a second extractor.[6]
How this fits with earlier posts on this site
Our post on agent evaluation reliability found that ranking model-plus-scaffold systems is reliable (0.935 to 0.994) while ranking underlying models is not (0.148 to 0.841), and that pooling diverse benchmarks helps more than piling on similar tasks. Mercor’s map is the external version of that argument: however much you pool, if the pool has none of your tasks, you still measure nothing about them. CheatBench shows that the scoring channel itself can be gamed, which is Mercor’s second obstacle. And in Eval Is Production, Anthropic found its problems by reviewing eval transcripts after the fact, and nothing in the scores showed them. All of them agree with the two new papers: an eval that keeps the score and discards the transcripts discards the most information.
A decision framework for model selection and internal evals
Ask the three questions in order.
Figure: three questions before picking a model. The first corresponds to Mercor’s coverage gap[1], the second to transcript judging after saturation[5], and the third to grader-driven gains[6].
In concrete steps:
- Write the task list. Describe a week of your team’s work at O*NET granularity, as in “review contract clauses and flag risks” rather than “legal work”, and estimate each task’s share of hours.
- Check each task against public benchmarks. Mercor’s map and its list of 29 benchmarks let you look up coverage for your occupation directly.[1][2] If a task has no matching items, do not let a leaderboard score stand in for it.
- Write your own items. Sample from real tickets, past PRs, and support logs until each task has several items. Mercor’s threshold is 5, and I treat that as a floor. Weight the total by the hour shares from step 1 instead of averaging over items.
- Check for saturation. When your candidate models all approach a perfect score on your items, stop ranking them by accuracy.
- Keep every transcript, including reasoning where you can get it, tool calls, and final outputs. For agentic tasks, do not drop the tool-call channel.
- Use pairwise judging to separate models, and calibrate it. Pick a few models whose performance on your work you already understand, calibrate the judge on comparisons among them, then add the new model. Use the newest and strongest references you have.
- Distrust the judge at a generation change. When a new model solves problems differently, such as a reasoning model replacing a non-reasoning one, test it directly on fresh hard items first.
- Spot-check the judge’s explanations. Look for a preference for length and tidy formatting over correctness.
- Name the grader. Attach the grader, the extractor, and the prompt version to every number. Re-score the same outputs with a second grader, and if the gap exceeds a few points, fix the grader before comparing models.
- Measure augmentation separately: completion time and rework on the same tasks with and without the model. Public benchmarks have almost nothing here.
Conclusion
Mercor’s map turns “the leaderboard doesn’t test my work” from a complaint into a task list you can check. The 90% figure will drop as Mercor adds benchmarks, but the tilt of coverage toward high-wage, highly exposed jobs will not change soon. Use public scores as a filter to rule out models that are clearly not good enough. Do not use them as the final word. The decision should rest on an internal eval built from your own task list, weighted by hours, with transcripts kept and graders named. Saturation is not the problem. The problem is finishing an eval and keeping nothing but the score.
References
- Mercor, A benchmark map of the US economy (Mercor Labor Index, Benchmark Map): https://www.mercor.com/research/labor-index/benchmark-map/ ↩
- Mercor, Benchmark Map, Benchmarks tab (the 29 benchmarks and selection criteria): https://www.mercor.com/research/labor-index/benchmark-map/benchmarks/ ↩
- Mercor, Benchmark Map, Methodology tab (LLM tagging and expert review): https://www.mercor.com/research/labor-index/benchmark-map/methodology/ ↩
- Hacker News, 90% of US working hours are spent on tasks not covered well by AI benchmarks (discussion thread): https://news.ycombinator.com/item?id=50121179 ↩
- Morio Hamada, Jehyeok Yeon, Matteo Migliarini, Justin Olive, Magda Dubois, Evaluating Model Capabilities After Benchmark Saturation, arXiv:2610.20667: https://arxiv.org/abs/2610.20667 ↩
- Zongye Lyu, Same Answer, New Box: How Much of RLVR’s Out-of-Domain Gain Is Answer Format?, arXiv:2610.20639: https://arxiv.org/abs/2610.20639 ↩
- RuntimeWire, Ryan Merket, Mercor estimates 90% of US work hours lack AI benchmark coverage: https://runtimewire.com/article/mercor-benchmark-map-human-work-thesis ↩